Module 21: Safety and security 40 min13 min quick readAI engineering
Fairness
Compute group fairness metrics (selection rate, TPR, FPR, PPV) per group, explain why they cannot all be equal when base rates differ, describe individual and counterfactual fairness, and choose and audit a fairness criterion for a real decision system.
Before this: Classification metrics and thresholds, Probability and statistics
Quick read: the intuition, interactive visualization, summary, and interview questions. The math, implementation, engineering, and knowledge-check sections are hidden.
Mental model. "Fair" is not one number. It is a choice of what to hold equal across groups: who gets selected, who gets missed, or how much a "yes" can be trusted. When the groups differ in how often the outcome really happens, you can hold one of these equal, but not all of them at once, so choosing is a policy decision you have to make and defend.
You will learn to
- Compute selection rate, true positive rate, false positive rate, and precision per group from a confusion matrix.
- State demographic parity, equal opportunity, equalized odds, and predictive parity, and what each one protects.
- Derive why equal error rates and equal precision cannot both hold when base rates differ (the Chouldechova identity).
- Describe individual fairness (similar people, similar decisions) and counterfactual fairness (the decision would not change if the protected attribute had been different).
- Choose a criterion for a use case, audit a model against it, and pick a mitigation (data, training, or thresholds).
Why it matters. Models now help decide loans, hiring screens, medical triage, fraud flags, and content moderation. A model can be accurate overall and still miss most qualified people in one group, or flag innocent people in another at twice the rate. Regulators, auditors, and interviewers ask the same thing: which fairness definition did you use, why that one, and what did it cost?
1. Intuition
Start from the confusion matrix, one per group. For each group, count true positives (selected, and the outcome was positive), false positives, false negatives, and true negatives. Every common fairness metric is a ratio from that table:
| Metric | Formula | Plain question |
|---|---|---|
| Selection rate | (TP + FP) / all | what share of this group does the model say yes to? |
| True positive rate (TPR) | TP / (TP + FN) | of the people who really qualify, what share do we catch? |
| False positive rate (FPR) | FP / (FP + TN) | of the people who don't qualify, what share do we wrongly say yes to? |
| Precision (PPV) | TP / (TP + FP) | when we say yes, how often are we right? |
Group fairness: pick which ratio to equalize.
- Demographic parity: equal selection rates. Protects against one group being selected less, whatever the reason. Ignores whether the outcome rates differ.
- Equal opportunity: equal TPR. Qualified people have the same chance of being caught in every group.
- Equalized odds: equal TPR and equal FPR. The model makes the same kinds of mistakes in every group.
- Predictive parity: equal precision. A "yes" means the same thing in every group. Closely related to calibration within groups: a score of 0.7 means a 70% chance in every group.
Why they collide. Suppose group A's real positive rate (the base rate) is 30% and group B's is 60%, and the model's scores are equally good in both groups. With one threshold for everyone, the model catches the same share of qualified people in both groups (equal TPR) and wrongly flags the same share of the rest (equal FPR). But B has more positives, so B gets selected more often (no demographic parity), and a "yes" in A is more often wrong because A has more negatives to make mistakes on (no predictive parity). Force equal selection rates and the error rates split apart. This is not a bug in the model; it is arithmetic. With different base rates, an imperfect classifier cannot have equal precision and equal error rates at the same time (Chouldechova 2017; Kleinberg, Mullainathan and Raghavan 2016 proved a related result for calibration).
Individual fairness (Dwork et al. 2012) asks something different: two people who are similar for this task should get similar decisions. Formally, the difference in decisions should be at most a constant times their distance. The hard part is the distance: deciding which features make two applicants "similar" is itself a policy choice.
Counterfactual fairness (Kusner et al. 2017) asks: would this person's decision change if their protected attribute had been different, with everything not caused by it held fixed? Answering needs a causal model of how the attribute influences the features. If being in group B lowers a test score because of unequal schooling, a model that uses the raw score is not counterfactually fair, even if it never sees the group label.
Dropping the attribute is not fairness. Zip code, school, name, and purchase history all carry group information. Removing the protected column ("fairness through unawareness") usually leaves the disparity in place and makes it harder to measure, because you can no longer compute per-group metrics.
Key distinctionThe choice depends on the harm. If a false positive is costly to the person (a fraud flag, a criminal-justice risk label), equal FPR matters most. If a missed positive is the harm (a qualified applicant rejected, a patient not referred), equal TPR matters most. If the decision is an allocation of a scarce benefit, selection rates may be what the law and the public care about. Write the choice down, with the reason.
2. Visualization
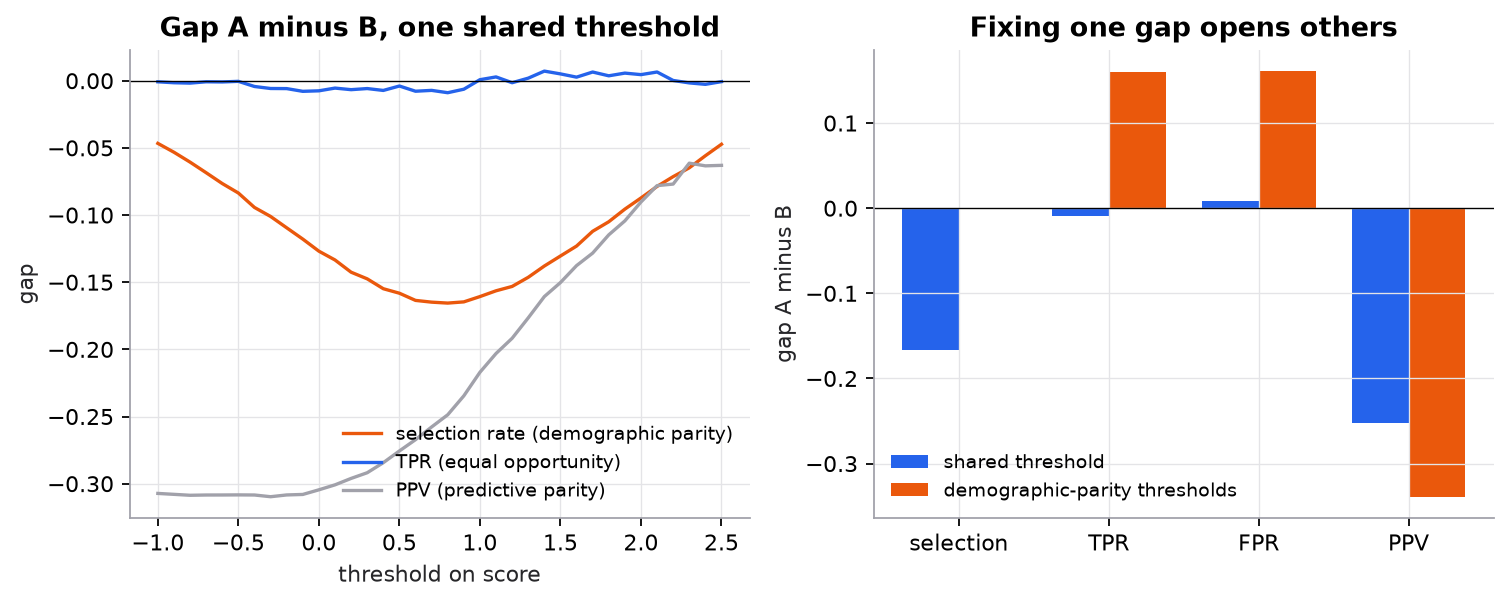
Synthetic data. Left: no shared threshold closes the selection-rate or precision gap, while the error-rate gap stays closed. Right: equalizing selection rates opens TPR, FPR, and precision gaps.
Try it (run fairness.py, predict first, then check):
- Set both base rates to 0.45. Predict which gaps close for a shared threshold.
- Make the score noisier for group A only (
rng.normal(1.5 * y, 1.6)when the group is A). Predict which criterion breaks first under a shared threshold. - Instead of equal selection rates, choose per-group thresholds that equalize TPR at 0.8. Predict the selection-rate gap.
- Change the decision in
lipschitz_violationsso applicant 2 gets 0.75. Is the pair still a violation at L = 1?
3. The math
Symbols
| Symbol | Meaning | Shape / range |
|---|---|---|
| protected attribute (group) | ||
| true outcome | ||
| model decision | ||
| base rate | ||
| per-group true positive rate, false positive rate, precision | ||
| task-specific distance between two individuals | ||
| Lipschitz constant |
The criteria
Equal opportunity is the half of equalized odds.
The identity that forces the trade-off
Within one group of size : and . Precision is , so . Substituting and solving for FPR:
If two groups share TPR and PPV but have different , the right-hand side differs, so their FPRs must differ. Only a perfect classifier (FPR = 0, PPV = 1) or equal base rates escapes.
Worked example
Synthetic: 100 people per group, base rates and . The model has TPR 0.8 and FPR 0.1 in both groups (equalized odds holds).
- Group A: 30 positives, 70 negatives. , .
- Group B: 60 positives, 40 negatives. , .
- Selection rates: A ; B . Demographic parity fails.
- Precision: A ; B . Predictive parity fails.
- Check the identity for A: . ✓
- Selection-rate ratio: . Under the US "four-fifths" rule of thumb used in employment, a ratio below 0.8 is treated as evidence of adverse impact that needs justification.
Individual fairness
Two applicants at distance who get scores 0.9 and 0.2 differ by , a violation at . Scores 0.9 and 0.85 differ by , which is fine.
Counterfactual fairness, one step at a time
Toy causal model: an applicant's test score is , where is ability (not caused by group) and is the group. Observed: , .
- Abduction (infer what isn't caused by ): .
- Action (flip the attribute): set .
- Prediction (recompute downstream): .
- Predictor : factual 5, counterfactual 3. Not counterfactually fair.
- Predictor : 3 in both worlds. Counterfactually fair.
The answer depends entirely on the causal model. If the "+2A" link is wrong, so is the verdict. That is the method's strength (it forces you to state assumptions) and its weakness (they are hard to verify).
4. Implementation
Build it from scratch
The full script is code/21-safety-security/fairness.py. NumPy only; all data is synthetic.
Synthetic groups with unequal base rates. The score depends only on the true label, so the model is equally informative in both groups. Any unfairness that appears comes from the base rates and the threshold choice, not from a biased score.
def make_group(p):
    y = (rng.random(N) < p).astype(int)
    score = rng.normal(1.5 * y, 1.0)          # same P(score | y) in both groups
    return y, score
Predict: with one shared threshold, which of TPR, FPR, selection rate, and PPV will be (nearly) equal across groups?
Per-group rates from the confusion matrix. Four counts, four ratios. This is the whole audit for group criteria.
def rates(y, pred):
    tp, fp = int(((pred == 1) & (y == 1)).sum()), int(((pred == 1) & (y == 0)).sum())
    fn, tn = int(((pred == 0) & (y == 1)).sum()), int(((pred == 0) & (y == 0)).sum())
    return {"sel": (tp + fp) / len(y), "tpr": tp / (tp + fn), "fpr": fp / (fp + tn), "ppv": tp / max(tp + fp, 1)}
Predict: a group has no positives in the audit sample. Which rate breaks, and what should an audit report instead of a number?
Thresholds that force demographic parity, and the identity check. Picking each group's threshold at the same quantile equalizes selection rates. The identity lets you predict one group's FPR from its other numbers.
def threshold_for_rate(score, rate):
    """Threshold that selects the top `rate` fraction of this group's scores."""
    return np.quantile(score, 1 - rate)

def chouldechova_fpr(p, tpr, ppv):
    """FPR implied by base rate p, TPR and PPV:  FPR = p/(1-p) * (1-PPV)/PPV * TPR."""
    return p / (1 - p) * (1 - ppv) / ppv * tpr
Predict: to select the same 47% of both groups, does group A's threshold go up or down compared with the shared one?
Individual fairness as a pairwise check. pairs, so in practice you sample pairs or check nearest neighbours.
def lipschitz_violations(features, decisions, L=1.0):
    """Individual fairness check: count pairs with |f(x)-f(x')| > L * d(x, x'), d = Euclidean distance."""
    bad = 0
    for i in range(len(features)):
        for j in range(i + 1, len(features)):
            if abs(decisions[i] - decisions[j]) > L * np.linalg.norm(features[i] - features[j]):
                bad += 1
    return bad
Predict: Euclidean distance on raw features treats a 1-point difference in income the same as a 1-point difference in age. Why does that make the check meaningless until you choose the metric?
Use the library
Fairlearn computes the same metrics per group and offers mitigations:
from fairlearn.metrics import MetricFrame, selection_rate, true_positive_rate, false_positive_rate
from fairlearn.postprocessing import ThresholdOptimizer

mf = MetricFrame(metrics={"sel": selection_rate, "tpr": true_positive_rate, "fpr": false_positive_rate},
                 y_true=y, y_pred=pred, sensitive_features=group)
print(mf.by_group, mf.difference())          # per-group table and max gap per metric

post = ThresholdOptimizer(estimator=clf, constraints="equalized_odds", prefit=True, predict_method="predict_proba")
post.fit(X, y, sensitive_features=group)     # learns group-specific thresholds (randomized where needed)
What the library adds: many more metrics, in-training mitigation (ExponentiatedGradient with fairness constraints), and dashboards. IBM's AIF360 covers similar ground plus pre-processing methods such as reweighing. Neither picks the criterion for you.
Run it
uv run code/21-safety-security/fairness.pyKey lines of output:
group A: positives 30, TP=24, FP=7, selected 31/100, PPV=24/31=0.774, identity FPR=0.100
group B: positives 60, TP=48, FP=4, selected 52/100, PPV=48/52=0.923, identity FPR=0.100
predictor f(X)=X:  factual 5.0, counterfactual 3.0  -> not counterfactually fair
one shared threshold (0.75):      A: sel=0.386 TPR=0.767 FPR=0.225 PPV=0.590  B: sel=0.553 TPR=0.777 FPR=0.217 PPV=0.843
per-group thresholds, sel=0.469:  A: sel=0.469 TPR=0.841 FPR=0.312 PPV=0.532  B: sel=0.469 TPR=0.682 FPR=0.151 PPV=0.871
gaps under demographic parity: {'sel': 0.0, 'tpr': 0.16, 'fpr': 0.161, 'ppv': 0.339}
identity check group A: base rate 0.297, measured FPR 0.225, implied 0.225
5. Engineering
Choose the criterion before you train. Start from the decision and its harms: who is hurt by a false positive, who by a false negative, and is the decision an allocation of something scarce? Involve legal, domain experts, and ideally affected people. Record the criterion, the groups, the tolerance (for example "TPR gap under 0.05"), and the reason.
Measure per group, with uncertainty. Report every metric per group, not only the one you chose, so trade-offs are visible. Small groups make rates noisy: a TPR on 40 positives has a 95% interval of about ±0.12 (1.96 × √(0.8 × 0.2 / 40)), so bootstrap confidence intervals and don't chase gaps smaller than the noise. Check intersections (group × age band), where small cells hide the worst gaps.
You need the attribute to audit. You cannot measure group gaps without group labels. Collect them with consent and access controls for auditing only, or estimate them carefully, and keep them out of the model's features if the law requires it.
Mitigations, by stage.
- Data: collect more examples from under-represented groups; fix label bias (labels that encode past discrimination, such as "was hired" or "was arrested").
- Training: reweighting, or constrained optimization that penalizes gaps.
- Post-processing: group-specific thresholds. Cheap and effective, but using the protected attribute at decision time is restricted in some domains (US credit and employment law, for example), so check before deploying.
Monitor after launch. Base rates and populations drift, so a gap that was closed at launch can reopen. Track per-group metrics as part of model monitoring, remembering that outcome labels arrive late.
Feedback loops. A model that rejects a group generates no repayment or performance data for that group, so the next model learns even less about it. Reserve some exploration, or use outcome data from other sources, when the decision controls which labels you see.
Generative models too. For LLMs, measure disparities in outputs across prompts that vary only the group (names, pronouns, dialect): refusal rates, sentiment, recommendation quality. The same idea, a counterfactual pair, applies.
Watch outFailure modes. Dropping the protected attribute and declaring the model fair; reporting only the metric that looks good; fixing a gap at the aggregate level while intersectional subgroups get worse; per-group thresholds that are illegal in your domain; training labels that encode historical bias; and gaps that reopen after deployment because nobody monitors them.
Common mistakes
- Treating "fair" as a single metric instead of a stated choice among conflicting ones.
- Assuming that removing the group column removes the bias.
- Comparing rates from tiny groups without confidence intervals.
- Optimizing for demographic parity when the real harm is missed positives (or the reverse).
- Auditing once at launch and never again.
- Trusting historical labels as ground truth when the history is the thing being questioned.
6. Knowledge check
Quiz: Fairness
Which condition is demographic parity?
Practice exercise. A loan model is audited on 200 applicants per group. Group A: 80 would repay, the model approves 64 of them and 24 of the 120 who would not. Group B: 120 would repay, the model approves 96 of them and 16 of the 80 who would not. Compute selection rate, TPR, FPR, and precision per group. Which criteria hold?
Solution
Group A: TP = 64, FN = 16, FP = 24, TN = 96. Selection . TPR . FPR . Precision .
Group B: TP = 96, FN = 24, FP = 16, TN = 64. Selection . TPR . FPR . Precision .
Equal TPR and FPR, so equalized odds (and equal opportunity) hold. Selection rates and precision differ, so demographic parity and predictive parity fail, as the identity predicts for base rates versus . Selection-rate ratio , just under four-fifths.
Implementation challenge. In fairness.py, write thresholds_for_equal_tpr(data, target) that picks a per-group threshold so each group's TPR equals target (use the quantile of that group's positive-class scores). Report all four rates at target = 0.8 and compare with the shared threshold.
Solution sketch
For each group, the threshold is np.quantile(score[y == 1], 1 - target), so exactly target of its positives score above it. Because the score distribution given y is the same in both groups here, the two thresholds come out almost equal, and the result looks like the shared-threshold row: equal TPR and FPR, unequal selection and precision. On real data where one group's scores are noisier, the thresholds differ, and equalizing TPR then moves FPR apart, which is why equalized odds can require randomized thresholds (what ThresholdOptimizer does).
Summary
- Group fairness criteria are ratios from per-group confusion matrices: selection rate (demographic parity), TPR and FPR (equal opportunity, equalized odds), and precision (predictive parity).
- When base rates differ, an imperfect classifier cannot equalize precision and error rates together: .
- Individual fairness bounds decision differences by a task-specific distance; counterfactual fairness asks whether the decision survives flipping the attribute in a causal model. Both move the hard choice into a metric or a causal graph.
- Removing the protected attribute does not remove bias and makes it harder to measure.
- Choose the criterion from the harm, measure every metric per group with intervals, mitigate at the data, training, or threshold stage within the law, and monitor after launch.
Next: Differential privacy
Related: Classification metrics · Securing AI systems · Model monitoring and drift · ML system design
Go deeper, code-first (AI Engineering from Scratch): Bias and Representational Harm in LLMs
Parts of this lesson are adapted from AI Engineering from Scratch by Rohit Ghumare (MIT license, notice): Fairness Criteria — Group, Individual, Counterfactual.
Interview angle
Why can't a classifier satisfy demographic parity, equalized odds, and predictive parity at the same time?
Because the groups' base rates differ, and the three criteria are tied together by the base rate. Within one group, true positives are TPR times the number of positives and false positives are FPR times the number of negatives. Precision is true positives over everything selected. Rearranging gives FPR equals p over one minus p, times one minus PPV over PPV, times TPR, where p is the base rate. If two groups share TPR and PPV but have different p, their FPRs have to differ. Similarly, with equal TPR and FPR, the group with more positives gets selected more often, so demographic parity fails. The only escapes are equal base rates or a perfect classifier. So in practice you choose which criterion matters most for the harm involved and accept, and report, the gaps in the others.
You're building a model that flags transactions for fraud review. Which fairness criterion would you prioritize, and why?
I'd start from the harm. A false positive here means a legitimate customer gets their card blocked or their payment held, which is a direct, visible harm to that person. A false negative mostly costs the bank. So I'd prioritize equal false positive rates across groups: innocent customers in every group should face the same chance of being wrongly flagged. I'd also watch true positive rate, so the model doesn't protect one group less. I wouldn't aim for equal flag rates, because if fraud targets some customer groups more, equal flag rates would mean more false flags in one group or more missed fraud in another. I'd report all four rates per group with confidence intervals, document the choice and why, and check that the review process itself doesn't add a second layer of disparity.
A team removed race from their hiring model's features and says the model is now fair. What do you say?
That removing the column doesn't remove the information. Zip code, school, name, gaps in employment, and even word choice in a résumé correlate with race, so the model can reconstruct much of it. Worse, without the attribute you can't measure the disparity anymore. I'd ask for an audit: collect self-reported race for evaluation only, compute selection rate, TPR, and FPR per group with confidence intervals, and check the four-fifths ratio on selection rates. I'd also look at the labels: if "good hire" comes from past managers' ratings, the labels may carry the bias directly. Depending on what the audit shows: better data, constrained training, or a review of which features act as proxies, all within employment law, which restricts using race explicitly at decision time.
Group A has a 30% base rate, group B 60%, and the model has TPR 0.8 and FPR 0.1 in both. What are the selection rates and precision?
Take 100 people per group. Group A has 30 positives, so true positives are 0.8 times 30, which is 24, and false positives are 0.1 times 70, which is 7. It selects 31, a 31% selection rate, with precision 24 over 31, about 0.77. Group B has 60 positives: 48 true positives and 0.1 times 40, or 4, false positives. It selects 52, so 52%, with precision 48 over 52, about 0.92. So equalized odds holds, but demographic parity fails, 31% versus 52%, and so does predictive parity, 0.77 versus 0.92. The selection-rate ratio is 31 over 52, about 0.60, well under the four-fifths rule of thumb, so in an employment context this would need a documented business justification or a different decision rule.